Contact us Visual analytics application to help scientists explore and triage molecular datasets in an intuitive, interactive wayEyemol
Core Purpose
EyeMol lets chemists and data scientists visualize molecules and interactively attach, filter, and analyze their properties (experimental or predicted).
EyeMol serves as a decision-support tool during drug discovery and chemical library management.
Features
Global vision of a dataset. All molecules are visible at once.
Group molecules by any property or by similarity.
No limit on the number of groups or number of molecules.
Drag and drop molecules from group to group.
Substructure search.
Lightweight graphic mode for large set of molecules.
A zoomed window to display currently selected molecule.
Property height & 3D colored bar graphs.
Create group inside groups.
Display numerical properties along the molecule.
Sort molecules inside groups by any property.
Color molecule cells by property.
Multiple views on the same dataset.
Minimap for quick navigation.
Cluster representative views.
Spreadsheet mode.
Download and Installation
EyeMol is only distributed in its Windows version. Please contact us directly via our contact page, if you would like to try it. We will be happy to help.
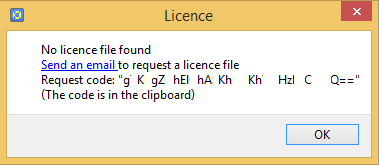
Once you have obtained a copy of EyeMol from us, unzip it to any directory of your choice and click the EyeMol.exe file in order to start EyeMol. A licence window will appear stating that no licence file was found in your installation and asking to send us an email with a licence request code:
Getting started
Once EyeMol is installed and licensed, our step-by-step tutorial walks you through every feature, from opening your first dataset to advanced clustering and property visualization. Browse by topic or search for a specific action.
We use cookies to ensure that we give you the best experience on our website. If you continue to use this site we will assume that you are happy with it.