Interactive Molecular Visualization &
Data Analysis Tool
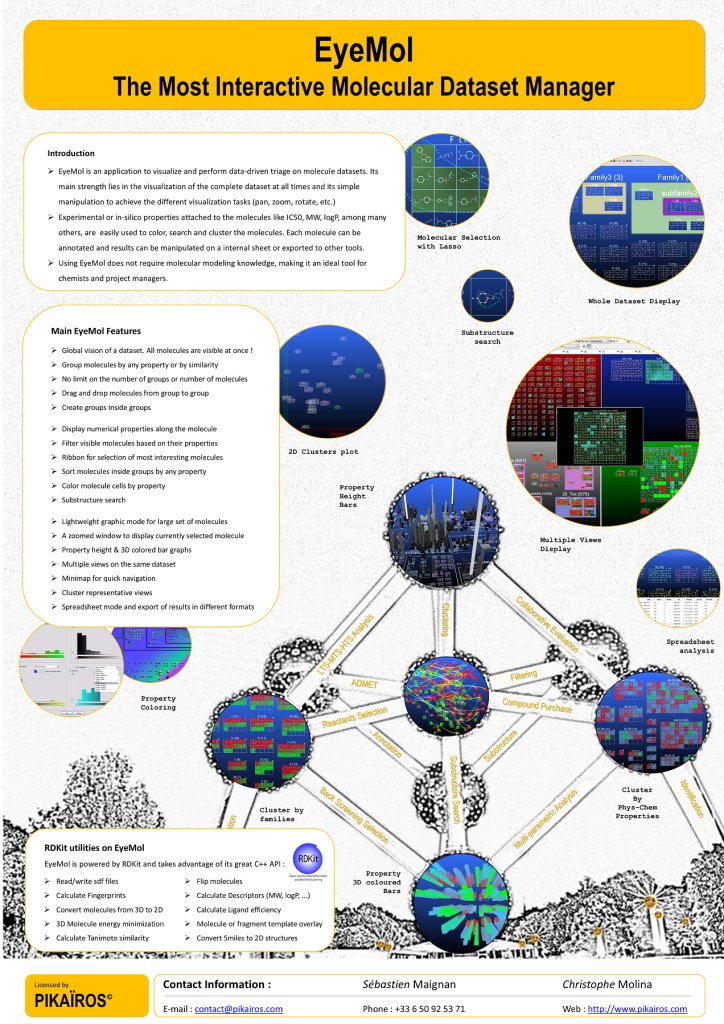
EyeMol is a visual analytics application to help scientists explore and triage molecular datasets in an intuitive, interactive way.
Core Purpose
-
EyeMol lets chemists and data scientists visualize molecules and interactively attach, filter, and analyze their properties (experimental or predicted).
-
EyeMol serves as a decision-support tool during drug discovery and chemical library management.
Download and Installation
EyeMol is only distributed in its Windows version. Please contact us directly via our contact page, if you would like to try it. We will be happy to help.
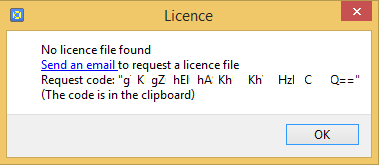
Once you have obtained a copy of EyeMol from us, unzip it to any directory of your choice and click the EyeMol.exe file in order to start EyeMol. A licence window will appear stating that no licence file was found in your installation and asking to send us an email with a licence request code: